A senator buys a stock — could be a blind trust. A hedge fund adds a position — could be rebalancing. An options sweep hits the tape — could be a hedge.
Acting on any single data point is poor decision making with extra steps.
But what happens when three structurally distinct data domains — political, institutional, and market — flag the same ticker within 21 days?
Same market. Same time period. The only variable: a structurally distinct source confirmed the same thesis.
What This Looks Like in Practice
Our supply chain graph mapped a dependency most investors missed: AXTI (AXT Inc.) manufactures indium phosphide substrates — the compound semiconductor wafers required for 800G optical transceivers. AAOI (Applied Optoelectronics) needs those substrates to build the transceivers powering AI datacenter interconnects.
The graph flagged the upstream link. Then four structurally distinct sources converged on each ticker independently.
InP Substrates
800G Transceivers
Demand Driver
- 13F: Coatue new position. Point72 initiated $24.8M. Citadel, Millennium, Two Sigma, RenTech all holding.
- FTD: 46,438 fails-to-deliver across 14 days — persistent delivery failures.
- Options: Unusual activity at 87th percentile IV, concentrated at $50 strike.
- Technical: 12-year range breakout. Volume climax at 4.2x average.
- 13F: Soros new position. Millennium new position. Griffin and Cohen hold large put hedges.
- FTD: 283,789 fails-to-deliver across 17 days — massive delivery failure.
- Options: $105 strike calls, 2.96x volume/OI ratio.
- Technical: 7-year range breakout. Volume climax at 3x average.
The chain: AXTI makes InP substrates → AAOI builds 800G optical transceivers → AI datacenters are the demand driver. Our graph mapped this upstream dependency before either stock moved.
AXTI and AAOI demonstrate what happens when convergence detection meets supply chain intelligence — the graph identified the structural dependency, then four independent data domains confirmed institutional interest in both the upstream supplier and the downstream customer. We track all convergences through resolution publicly. See full convergence history →
What Convergence Actually Means
Convergence is not "lots of data points." A tweet and a Reddit post about the same stock is one data point with two echoes — same information domain, no structural distinction. Convergence is the detection of activity across structurally distinct information domains pointing at the same ticker within the same time window.
The key word is structurally distinct. A senator on the Energy Committee buying a stock and a DOE contract being awarded to the same company come from different institutions, different disclosure timelines, and different decision-making processes. When they converge, you are observing something the market has not yet priced — not because the information is hidden, but because nobody is cross-referencing these filings in real-time.
Who Built This
Seven years inside Amazon's constraint systems — regulatory deadlines that couldn't slip, manufacturing floors that forced procurement, compliance rules that triggered real economic action regardless of anyone's intent. The job was identifying forced actions before they played out.
ForcedAlpha applies the same thinking: find the structural constraints that force capital to move, then map the chain before the market prices it. Congressional filings, institutional holdings, lobbying spend, federal contracts — each one is a disclosure of a forced action.
Today it's bigger than one person. We run 34 live scanners across public filings, publish every detection at the moment we find it, and track every outcome publicly. On top of that, we built a proprietary supply chain intelligence graph — 2453 nodes, 8441+ edges across 161 relationship types — computing metrics like cascade exposure and chokepoint asymmetry ratios that don't exist anywhere else.
The deep dive covers how we select what to watch (170+ tickers across 10 supply chain layers) and why these nine sectors are one interconnected system, not nine separate themes.
Why Structural Distinction Matters
If you assume each source has a 30% chance of producing a false positive on its own, the math on multiple structurally distinct sources converging gets interesting fast:
Important caveat: These probabilities assume the sources are structurally distinct — drawn from different institutional processes with different disclosure timelines. In practice, some sources share common drivers — a congressional trade and a lobbying spike may both reflect the same policy momentum. This is exactly why we categorize by domain and only count cross-category convergences. Within-category stacking (e.g. two technical patterns) does not increase our conviction score.
More Sources = Better Outcomes
The theory above predicts that more structurally distinct sources should produce better outcomes. Here is the empirical evidence across — convergences:
| Sources | Count | Median Return | Win Rate | Alpha vs SPY |
|---|
Structurally distinct sources reduce false positives. The data confirms: more independent domains converging on the same ticker produces measurably better outcomes.
The Taxonomy Is the Moat
Tracking data sources isn't the hard part — mapping how they connect is. We built a 10-layer supply chain taxonomy from years of mapping cross-border commerce: raw materials to end-user software, every dependency charted. When you understand which companies sit at which layer, you can trace how a single policy decision ripples through the entire stack.
Why Dual-Position Companies Matter
The most interesting opportunities sit at companies that span multiple layers. These "dual-position" plays have compounding exposure to the same macro theme:
These are the "aha" moments in our taxonomy — where a single thesis benefits from multiple layers of the same structural trend. Full 7-layer AI Infrastructure Framework with 45+ tickers →
Supply Chain Intelligence Graph
The taxonomy above is a static map. We built a computational graph on top of it — a directed, weighted network of 2453 nodes and 8441+ edges spanning 161 relationship types — from raw material dependencies to policy impacts to conflict exposures. It maps every forced connection between companies, facilities, policy actors, and materials across 10+ sectors, computing intelligence layers that don't exist in any other published research.
The graph computes 7 convergence types per node (bottleneck, policy, actor, temporal, conflict, cross-sector, facility), identifies companies caught between competing forces, traces cause-and-effect chains across 5 years of policy data, and flags convergences that didn't lead to price moves — so you know what to avoid, not just what to follow. Convergence data from our 34 scanners is overlaid onto the graph, so a convergence hitting a critical chokepoint node carries more weight than one hitting a commodity.
Supply Chain Graph Triples the Alpha
Convergences hitting tickers in our supply chain graph consistently outperform those that don’t:
Severity measures how critical a company is as a chokepoint — how hard it is to replace. Higher severity nodes show stronger convergence outcomes:
| Severity | Win Rate | Median Return | Description |
|---|
The key distinction: A senator's trade, a fund's 13F filing, and a lobbying spike are three distinct actors making separate decisions through different institutional processes — each with real capital at risk. We track forced actions, not sentiment.
34 Live Public Data Sources
All 34 convergence sources are public — filed with the government or posted on public exchanges. The intelligence layer we compute on top of them — the supply chain graph, asymmetry ratios, cascade exposures — is proprietary. Full descriptions of All 34 sources: what each one detects, how it's weighted, and why some lead while others confirm →
What Institutional Convergence Looks Like
Our 13F scanner tracks 24 elite fund managers and 8,628 holdings. When we detect thesis-aligned rotation across multiple distinct funds, that is institutional convergence — and it looks like this:
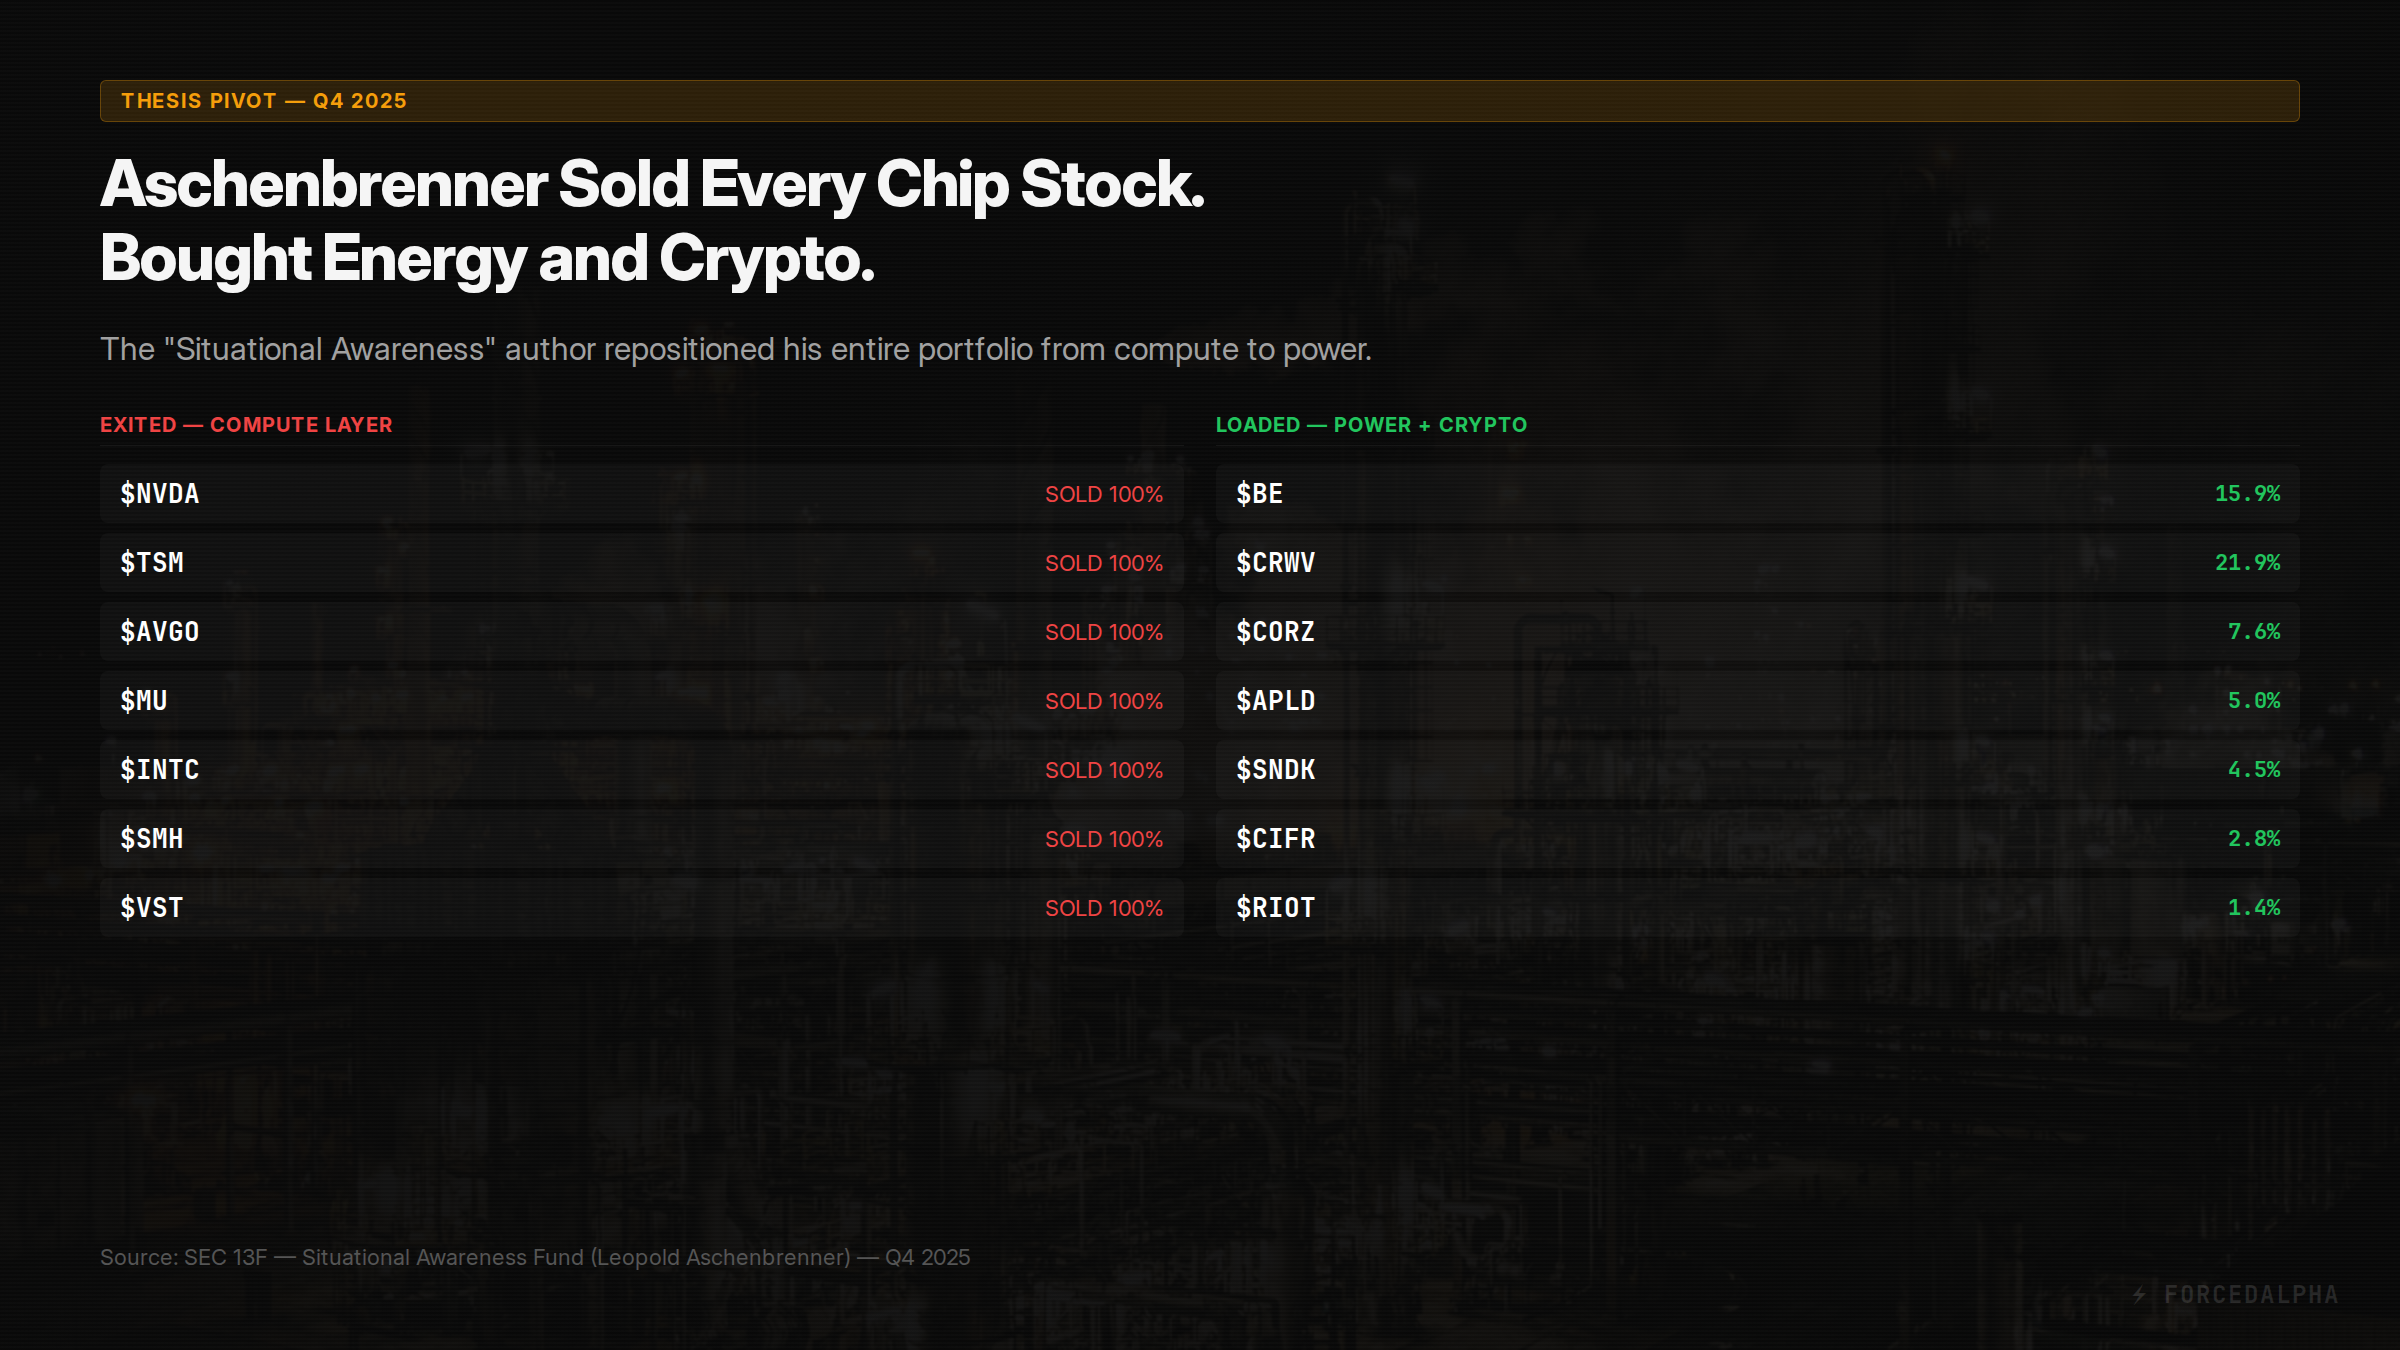
Leopold Aschenbrenner — the ex-OpenAI researcher whose Situational Awareness paper became the most cited AI scaling analysis of 2024 — sold every chip position and loaded energy + crypto infrastructure. In our taxonomy, that is a Layer 7 (Compute) → Layer 4 (Power) rotation. When the person who literally wrote the book on AI scaling bets his fund on power infrastructure, that is a high-conviction data point. Source: SEC 13F, Q4 2025 filing.
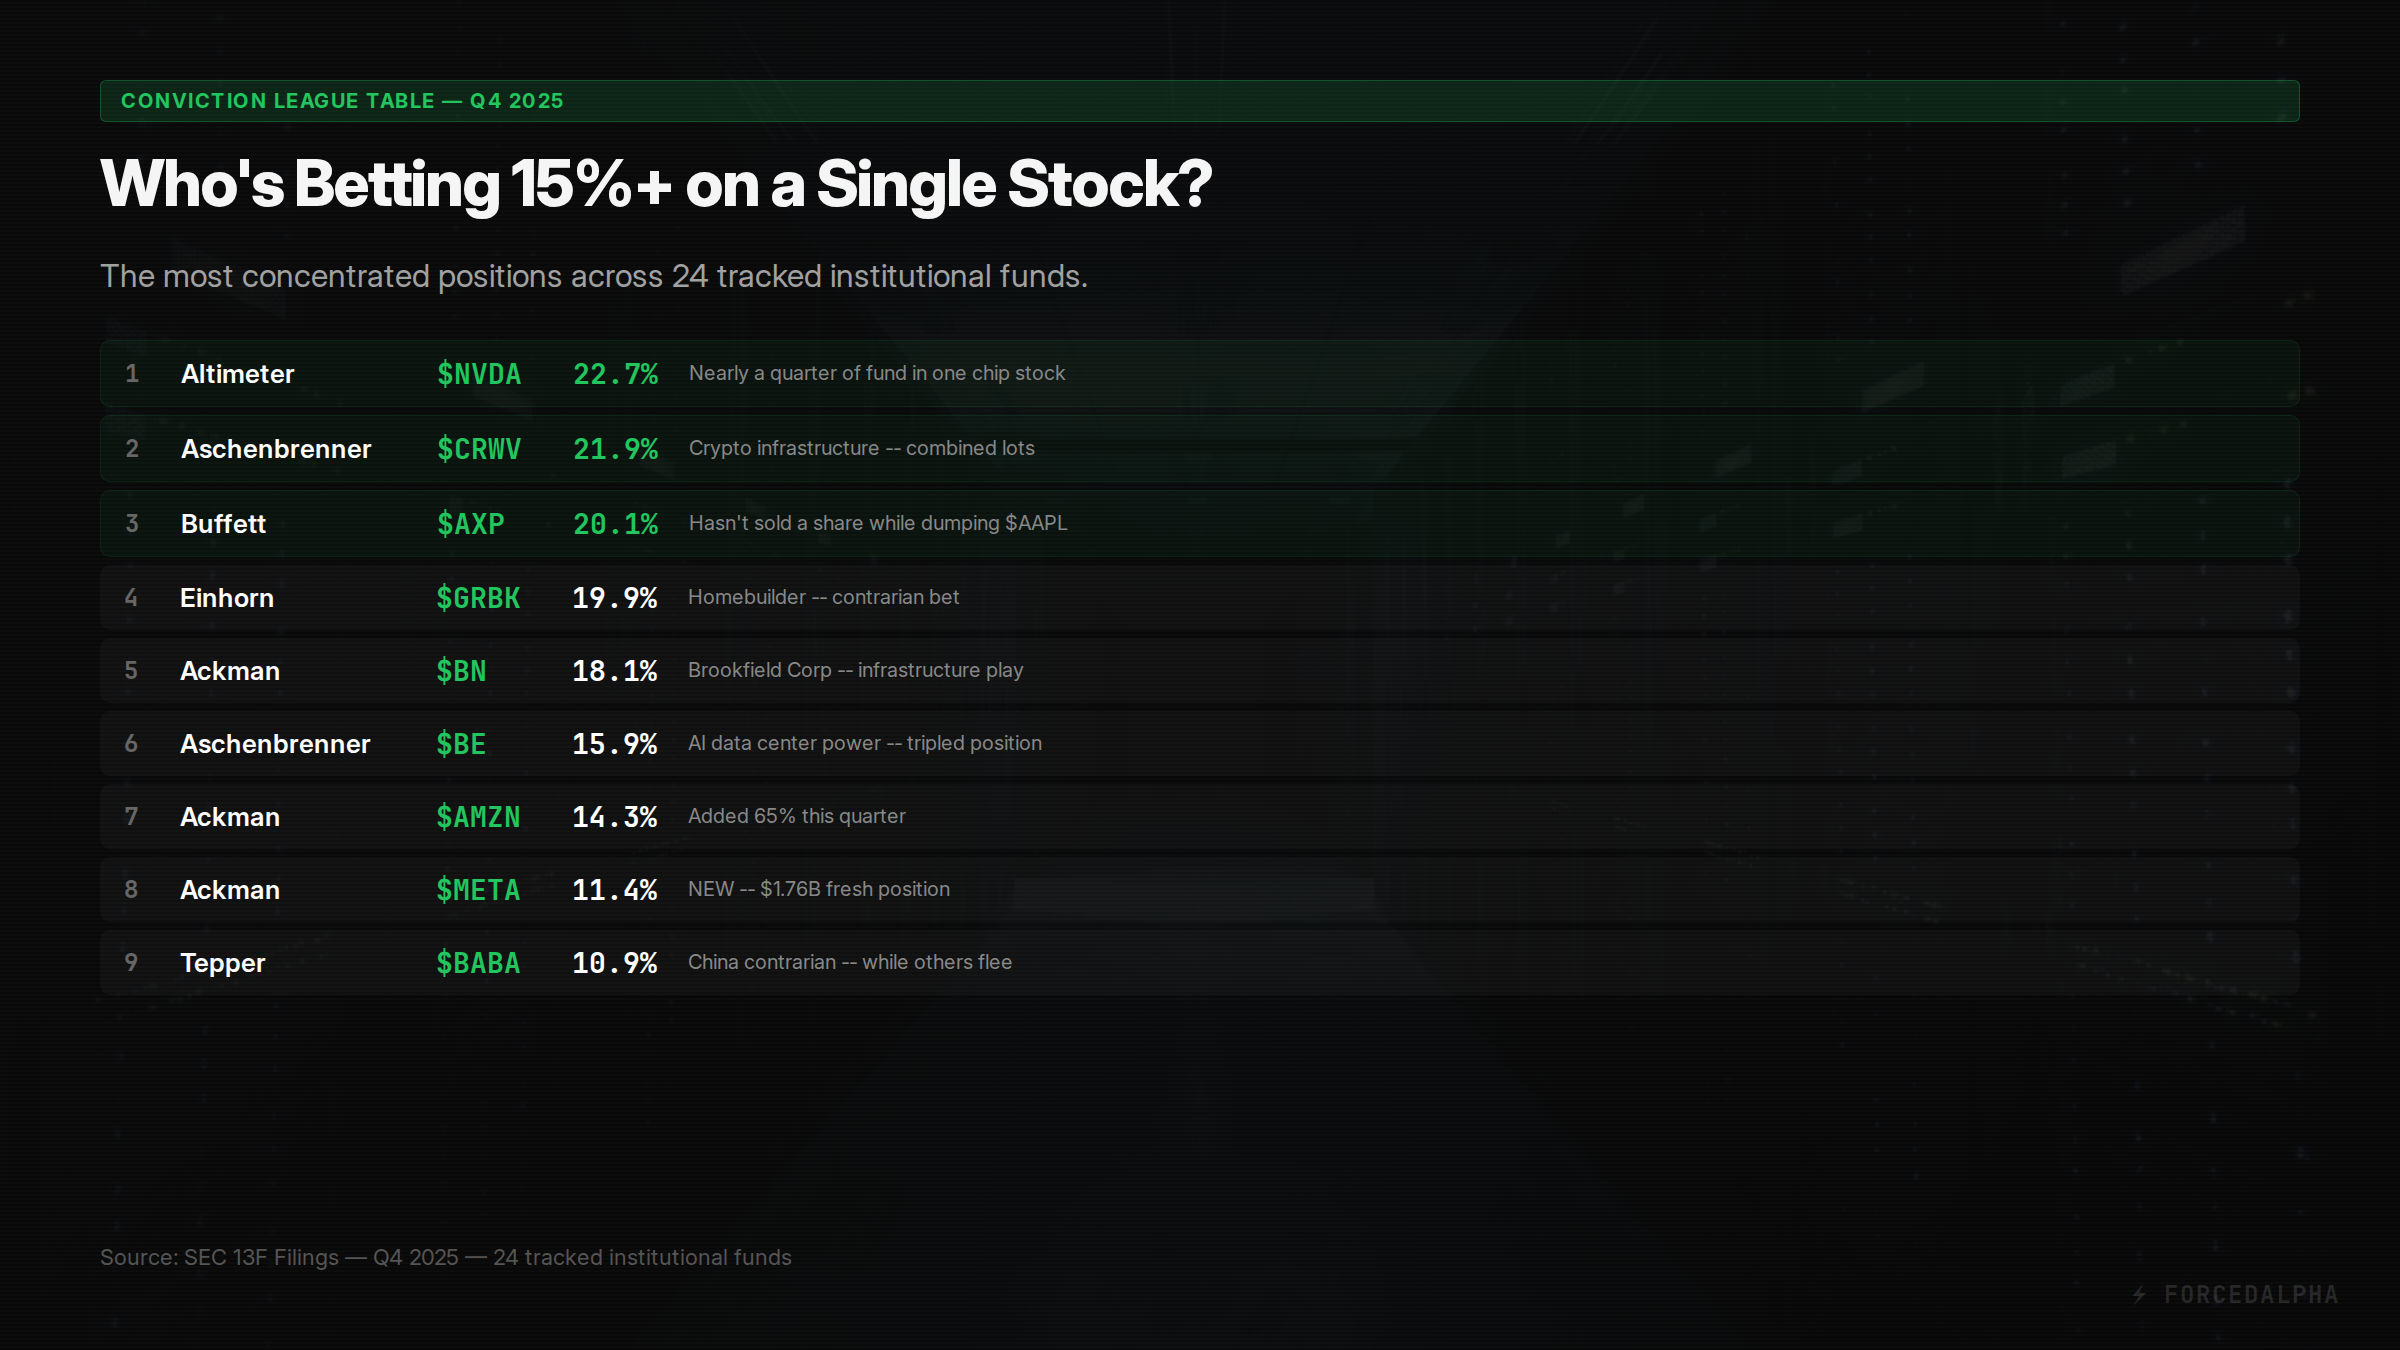
Concentration = conviction. When a fund manager puts 20%+ in a single name, they are making a statement the market hasn't priced. We rank all 24 tracked managers by portfolio concentration to surface the highest-conviction bets. Source: SEC 13F, Q4 2025.
Does It Work?
Nine is not a sample size. A 100% hit rate on 9 events is more likely small-sample luck than system perfection. We publish every convergence at detection — not after resolution — specifically so this record cannot be curated after the fact.
What makes the original seven worth studying is the control group. You saw the numbers above: 526 isolated chart patterns produced coin-flip results. The first seven used two source categories (congressional + technical). AXTI and AAOI are the first to use four source categories (13F + FTD + options + technical) — and the first pair linked by our supply chain graph. Add one structurally distinct non-technical source — a committee-relevant congressional trade — and the outcome changed. Here are all 9:
| Ticker | Source Categories | Detection | Return |
|---|---|---|---|
| AVGO | Congressional + Technical | May 8, 2025 | +47.1% |
| AMD | Congressional + Technical | Jul 16, 2025 | +36.2% |
| AVGO | Congressional + Technical | Jun 3, 2025 | +18.0% |
| LHX | Congressional + Technical | Jun 11, 2025 | +14.3% |
| NVDA | Congressional + Technical | Jun 27, 2025 | +13.0% |
| BAC | Congressional + Technical | Jun 27, 2025 | +11.4% |
| GE | Congressional + Technical | Jul 14, 2025 | +11.3% |
| AXTI* | 13F + FTD + Options + Technical | Feb 12, 2026 | +68% |
| AAOI* | 13F + FTD + Options + Technical | Feb 13, 2026 | +115% |
Returns measured from detection date to 90 calendar days, using closing prices. *Active position — return measured from detection to current price, updated daily. Returns are absolute, not risk-adjusted — we do not yet benchmark against sector or market indices. Full backtest data →
Structural distinction — not pattern count — drives the edge. 526 events from 2025. 9 total convergences qualified. We show both numbers because the contrast is the entire thesis.
We are in the "Discovery Alpha" phase. Seven events is directional, not proof. But this is also when a system's edge is most potent — before the methodology is commoditized by the broader market. The alpha from convergence detection exists precisely because nobody else is cross-referencing these filings in real-time.
The table above is the complete record — AVGO appears twice because it was detected in separate windows. We publish every convergence at detection, not after resolution, specifically so this record cannot be curated after the fact.
As the sample grows, we expect losses. When they happen, they will be in the table above and in our public scorecard. That transparency is the mechanism that keeps us honest.
Convergence Indicators Need Time
Most convergences are measured too early. The sweet spot for structural convergences to resolve into price is the 61–90 day window:
| Period | Count | Median Return | Win Rate |
|---|
The 61–90 day window is where structurally distinct indicators resolve into price. This is why we report 90-day returns as the primary metric.
What We Get Wrong
We publish this section because we've seen too many platforms bury their limitations in legal footnotes. If this system stops working, we want the data to show it before the marketing does.
- Filing delays are real. Congressional trades disclosed up to 45 days late. 13Fs quarterly. Returns measured from disclosure, not trade date.
- Small sample at the top. 9/9 is directional, not proof. Every convergence published at detection — not after resolution. Losses will come, and they'll be in our public scorecard.
- Returns are not risk-adjusted. We don't yet benchmark against sector indices or risk-free rates.
- Bearish convergences underperform. Bullish win rate: ~48%. Bearish: ~40%. The system finds longs better than shorts. We are investigating whether this reflects a genuine limitation or a bull market bias in the sample period.
Why Convergence Detection Matters Now
At the Munich Security Conference in February 2026, leaders from the US, Germany, and France declared the post-1945 world order dead. Ray Dalio classifies this as Stage 5 of the Big Cycle — the phase where rules break down and great powers compete across five simultaneous fronts: trade, technology, capital, geopolitics, and military.
In the old world, fundamentals drove prices and policy was secondary. Earnings beats and revenue growth determined winners. In a Stage 5 world, policy drives prices and fundamentals are secondary. A single DPA invocation, export control, or tariff announcement can move a stock more than five quarters of earnings.
This is exactly why tracking congressional trades, lobbying expenditure, 13F filings, and federal contracts produces alpha. The people making policy are the leading indicator. When a defense committee member trades a rare earth stock before an export control announcement, that is not noise — it is the Stage 5 cycle being priced in real-time by insiders.
Our 34 scanners detect activity across all five domains. Read the full Great Power Cycle framework →
From Convergence to Conviction
Convergence detection tells you what to watch. We built three quantitative layers on top to tell you how much edge each convergence creates.
Technical deep dive: worked examples for Bayesian, LEAPS, and Macro models → | Live LEAPS scanner →
See It In Action
Browse live convergence alerts, congressional trades, institutional holdings, and deep-dive playbooks.
Browse Tools →