The thesis is simple: when structurally distinct public data sources converge on the same ticker within the same time window, that convergence contains information that any single source alone does not.
We've proven this for two source types: congressional trades + technical breakouts. 7 resolved convergences, 7/7 positive, +21.6 average return vs. +3.2 for isolated events. That's the foundation. We're now testing whether adding more structurally distinct domains — lobbying, 13F filings, federal contracts, policy actions — improves outcomes further. We scan 34 data feeds total. Below is everything: how the sources work, how scoring works, what the backtest shows, and where the methodology is weakest.
Want to see the evidence before the machine? Skip to backtest results →
Case Study: AVGO — +47.1% in 3 Months
Two structurally distinct data domains flagged the same ticker within a 30-day window:
- Congressional: Committee-relevant members disclosed AVGO positions
- Technical: Multi-year range breakout on elevated volume confirmed the directional thesis
Neither source alone warranted a position. A congressional trade is one data point. A chart breakout is a coin flip. But when people with policy access are positioning in the same direction the chart is confirming — that's a different probability.
Result: AVGO +47.1% over 3 months from detection dateReturn measured from May 8, 2025 close to August 6, 2025 close. This is the strongest of our 7 resolved Congressional + Technical convergences. See all 7 results below.
How Scoring Works
Each opportunity gets a composite score from 0–100 based on three principles:
Structural distinction matters most. A congressional trade + an institutional filing + a federal contract = three structurally distinct confirmations. A congressional trade + a tweet + a Reddit post = one data point with two echoes.
Recency decays. An institutional filing from last quarter carries less weight than an insider transaction filed yesterday.
Quality over quantity. Not all congressional trades are equal. We weight by disclosed trade size, the member's committee seniority, and whether their committee has direct jurisdiction over the sector in question. A senior member of the Armed Services Committee trading a defense contractor carries more weight than a freshman representative on an unrelated committee making the same trade.
| Score | Classification | What It Means |
|---|---|---|
| 80–100 | Strong Convergence | 3+ structurally distinct sources aligning within 30 days. ~5% of detections. Worth building a full thesis around. (Our resolved backtest covers 2-source events; 3+ source convergences are being tracked in active case studies.) |
| 60–79 | Moderate Convergence | 2+ confirming sources with quality data. Worth deeper analysis. ~15% of detections. |
| 40–59 | Developing | Early pattern. One strong indicator with a possible second forming. Monitor, don't act. ~30% of detections. |
| Below 40 | Noise | Single-source or low-quality alignment. Filtered out entirely. ~50% of detections. |
Data Sources
We scan 34 live public data feeds. They are not equal. 11 core sources drive the vast majority of high-conviction convergence detections. The remaining 25 provide confirmation, timing context, or are still being validated. No dark pool scraping. All 34 convergence sources are government filings or public exchange data. The intelligence layer computed on top of them — the supply chain graph, asymmetry ratios, cascade exposures — is proprietary.
Core Edge — Forced Action Sources
These sources reveal who must act, who is acting, and where capital is being directed by policy. They lead.
Confirmation & Context Layer
These 25 sources provide timing context, sector-level indicators, or are still building enough data to evaluate impact. They don't drive convergence scores on their own. Sources marked NEAR CORE are closest to Core promotion based on directional impact observed so far.
| Source | What It Tracks | Why It Matters |
|---|---|---|
| Prediction Markets NEAR CORE | Polymarket odds on policy events, elections, regulatory outcomes | Increasingly a leading indicator for policy-sensitive sectors. Evaluating reclassification to Core for defense/energy names. $155M+ volume on geopolitical markets. |
| Federal Job Postings NEAR CORE | Agency hiring across DOE, DOD, NRC, DARPA | Agencies hire before budget announcements. DOE posting 40 nuclear engineer roles means something's been approved that hasn't been announced. Sector-level momentum confirmed; ticker-level convergence detection building. |
| Fed Funds Futures / FedWatch NEAR CORE | Implied rate path from CME Fed Funds futures, dot plot divergences | Quantitative replacement for subjective Fed-watching. Regime shifts (cuts → holds, holds → hikes) create predictable sector rotations. Term structure inversion flags event anticipation. |
| Trade Policy & Tariffs | Export controls, tariffs, sanctions, trade agreements | Direct supply chain impact. Creates forced buyers and sellers overnight. |
| Transcript Sentiment | Earnings call tone shifts, guidance delta, analyst sentiment via NLP | A beat with cautious guidance is bearish; a miss with aggressive forward estimates can be bullish. The qualitative layer raw EPS numbers miss. |
| Credit Stress Indicators | IG/HY spreads, debt rating changes, refinancing risk | Credit markets price deterioration before equity markets react. Sector-level early warning. |
| FINRA Short Interest | Bi-monthly SI reports, daily short volume ratios | High SI + bullish convergence from other sources = coiled spring. Forced covering amplifies moves. |
| SEC FTD Data | Failure-to-deliver volumes, T+35 settlement clocks | Persistent FTDs create mechanical forced buying under Reg SHO. Additional buying pressure on convergence names. |
| ETF Flow Tracking | Sector/thematic ETF inflows and outflows across 40+ ETFs | Capital rotating into defense ETFs while individual names haven't moved = actionable divergence. |
| Dilution Filings | S-3 shelf registrations, ATM offerings, secondaries | One of the most reliably bearish indicators for small/mid-caps. Downgrade trigger for convergence scores. |
| Debt Maturity Schedules | XBRL-extracted maturity walls, refinancing windows | Companies with concentrated near-term maturities face forced action: refinance, restructure, or dilute. |
| Buyback Execution | Actual repurchases vs. authorized amounts from 10-Q | High execution (>60%) confirms management conviction. Low execution despite authorization is a negative divergence. |
| Treasury Auctions | Bid-to-cover ratios, indirect bidder participation, yield tails | Weak auctions indicate deteriorating demand for US debt, foreshadow higher rates for duration-sensitive sectors. |
| SEC Expanded Filings | NT notifications, 10-K/A amendments, proxy fights, material 8-Ks | Late filings = weak bearish. Contested proxies provide activist catalyst timing. |
| SEC Comment Letters | CORRESP filings — SEC staff scrutiny of disclosure | Bearish-biased. Active SEC review can precede restatements or enforcement actions. |
| Corporate Job Postings | "Special Projects" hires at principal level | Hiring precedes announcements. Directionally strong but not yet ticker-level convergence-contributing. |
| Hyperscaler Contracts | AWS/Azure/GCP data center buildouts, PPAs, supply deals | Sector context for AI/energy. Provides the demand-side backdrop. |
| Fed Speaker Sentiment | Governor hawkish/dovish lean cross-referenced with sector positioning | Timing layer for REITs, homebuilders, and duration-sensitive names. |
| BIS/IMF Policy Papers | Working papers on AI regulation, CBDC, trade frameworks | 6–18 month leading indicators for policy action. Scored by theme relevance. |
| CFTC Positioning | Commitments of Traders reports — commercial vs speculative positioning | Extreme positioning (commercials vs speculators diverging) historically precedes major reversals. |
| FTD & Short Pressure | Combined FTD + SI + short volume composite | Composite measure of mechanical selling/buying pressure on individual names. |
Honest accounting: Of 34 data feeds, 11 core sources have directly contributed to convergence detections. The remaining 25 provide confirmation, timing context, or are accumulating data. The 3 sources marked NEAR CORE are closest to reclassification based on observed directional impact. We track all 34 because convergence detection improves as more structurally distinct domains fire simultaneously — but we don't pretend all 34 are equally impactful today.
How We Select What to Watch
Before convergence detection starts, there's a harder question: are we watching the right companies in the first place?
Most platforms track obvious names: GPU makers, defense primes, utilities. We track the entire interconnected system — every input, dependency, and shared supplier across the supply chains that matter.
One System, Not Eight Sectors
AI, Defense, Energy, Robotics, Quantum, Space, Cyber, and Reshoring aren't eight separate themes. They're one interconnected system with shared inputs, and those inputs create flywheels that feed off each other.
AI needs power. Power needs nuclear and natural gas while the grid is maxed, and solar plus storage to bridge the gap. Defense needs AI. Robotics needs AI. Crypto shares AI infrastructure. All of them need semiconductors, and semiconductors need rare earths, specialty glass, advanced optics, and precision manufacturing. Every one of these chains feeds the others.
And the whole thing is supercharged by a single policy reality: US policy is structurally aligned with technological primacy over China. The CHIPS Act, Defense Production Act invocations, IRA subsidies, AUKUS, export controls — these aren't one-off events. They're a sustained policy put that backstops entire supply chains.
Layered Supply Chain Taxonomy
We organize every company by its structural position across these interconnected themes. Not by sector label, but by what it actually does in the chain:
- Resource & fuel layer — CCJ, MP, UUUU, FCX. Uranium miners, rare earth processors, lithium extractors, copper producers.
- Power & grid layer — CEG, VST, NEE, SO. Generation, transmission, distribution, substations, transformers.
- Infrastructure layer — EQIX, DLR, VRT, BE. Data centers, cooling systems, thermal management, power conditioning.
- Compute & memory layer — NVDA, AMD, AVGO, RMBS*. Processors, accelerators, memory, FPGAs.
- Equipment & tooling layer — ASML, AMAT, LRCX, KLAC. Lithography, deposition, etch, inspection, EDA design tools. Structurally irreplaceable.
- Connectivity layer — ANET, MRVL, CRNT, GLW. Networking silicon, switches, fiber optics, specialty glass.
- IP & licensing layer — ARM, CDNS, SNPS, RMBS*. Patent royalties, architecture licensing, per-unit fees.
- Components & sensors layer — FLIR, ISRG, TER. Machine vision, infrared optics, actuators, precision instruments.
- Platform & software layer — AMZN, MSFT, PLTR, SNOW. Cloud, enterprise AI, autonomous systems software.
- Construction & services layer — CAT, MLM, VMC, PWR. Heavy equipment, aggregates, engineering, permitting.
* RMBS appears in both Compute and IP layers — it sells memory interface chips (compute) and collects patent royalties on every DDR5/HBM module shipped (IP). That dual positioning is exactly the kind of cross-layer structural advantage our taxonomy is designed to surface.
Companies that serve multiple themes simultaneously are where the most overlooked opportunities live. This static taxonomy is now backed by a computational graph with 2453 nodes and 8441+ edges that runs algorithms to surface these cross-theme positions automatically. The full watchlist behind Pro covers 170+ tickers across all 10 layers.
How Discovery Actually Works: A Real Example
Static watchlists miss what's coming. Here's how our taxonomy-driven discovery process works in practice:
Starting point: CCJ (Cameco) was already tracked as a uranium miner — Layer 1 in our taxonomy.
Automatic dependency mapping traced downstream: CCJ mines uranium, but who converts it to UF6 fuel? The system's dependency mapper flagged a single bottleneck: Solstice Advanced Materials (SOLS), operating the Metropolis Works facility in Illinois — the only NRC-licensed UF6 conversion plant in the country. Nobody else in the US does this.
Cross-theme intersection auto-flagged: SOLS sits at Layer 2 (Processing) and Layer 4 (Power) — dual-position. Same company supplies nuclear fuel and refrigerants for data center cooling. The system flagged this AI + Energy intersection automatically for deeper analysis.
Result: A structural monopoly thesis that nobody else was publishing. SOLS became one of our highest-conviction playbooks — and the system found it by tracing the supply chain at scale, not by screening financials.
This process runs continuously across all 170+ tracked tickers. When new legislation, a contract award, or a 13F filing surfaces a company we aren't tracking, the system flags it for taxonomy mapping. Self-healing loops catch unmapped politicians, untaxonomized tickers, and stale data automatically.
Supply Chain Graph Intelligence
The taxonomy tells you where companies sit. The graph tells you what happens when one of them breaks.
We maintain a proprietary directed, weighted graph — 2453 nodes (985 companies, facilities, and policy actors + 342 materials) connected by 8441+ edges (161 relationship types) across 22+ sectors. The graph spans three layers — physical supply chain, demand/application, and capital/financing — with 94 algorithms running daily to compute 30 intelligence layers that don't exist in any other published research. The graph is not a visualization — it's a computation engine.
Why this doesn't exist elsewhere: Sell-side research covers individual supply chains in isolation. Everstream and Resilinc map procurement relationships for operations teams. Academic papers cover single materials. Nobody has built a computational graph that runs algorithms across all materials and companies simultaneously to find emergent systemic risks — and nobody else computes investment-grade metrics on top of that topology.
1. Asymmetry Ratios (Chokepoint Alpha)
The mismatch between a company's own market capitalization and the total downstream market cap it gates. Computed at every node in the graph.
Formula: Chokepoint Alpha = (Severity × Downstream Market Cap) / Own Market Cap
Severity is scored 1–5 based on substitutability, qualification timeline, geographic concentration, and production capacity. Score 5 means irreplaceable with no substitute and a qualification timeline exceeding 24 months.
Example: AXT Inc trades at ~$1.5B market cap. It produces indium phosphide and gallium arsenide substrates for compound semiconductors used in 5G, photonics, and defense systems. The graph traces downstream through compound semiconductor fabricators to end users: total downstream market cap gated is $13.4 trillion . That produces an asymmetry ratio of 8,947x . This number cannot be guessed — it requires the full graph topology to compute.
2. Cascade Exposure (Deduplicated)
The total downstream market capitalization disrupted if a single material or component becomes unavailable. Computed via breadth-first search traversal from the disruption node to all reachable endpoints.
Why deduplication matters: When multiple cascade paths share downstream nodes (gallium disruption and rare earth disruption both ultimately affect NVIDIA), naive summation double-counts. We track unique downstream nodes across all paths, producing the true risk number rather than an inflated one.
Novel computation — the simultaneous cascade: Running ALL China-controlled severity-5 material cascades simultaneously and deduplicating shared downstream nodes produces a single number: the true combined exposure of a coordinated supply chain disruption. Nobody has published this because nobody has the graph topology to compute it.
3. Cross-Theme Collision Points
Nodes where 2+ of the 9 themes share a dependency that neither industry tracks on its own. The graph is tagged by theme; collision detection runs at every node to identify where themes converge.
When fluoropolymers appear in AI (fab seals and etch gases), Energy (reactor coatings), AND Defense (radar domes), that's a collision point. Each industry models its own supply chain in isolation — semiconductor analysts don't talk to defense procurement analysts. The collision points only emerge from mapping all nine simultaneously.
4. Second-Order Cascades
Cross-industry chain reactions where disruption in one sector triggers failure in an apparently unrelated sector. Found by tracing cascade paths and identifying when two paths from the same disruption reach endpoints in different themes.
"ABF disruption kills GPUs" is a first-order cascade. "ABF disruption kills GPUs and automotive ECUs" is a second-order cascade — the auto industry doesn't know it shares a chokepoint with NVIDIA. We've mapped 12+ of these cross-industry chain reactions.
5. Time Traps (Qualification Walls)
A metric combining qualification timeline (months to validate a new supplier) with severity score to identify dependencies that money and policy cannot fix on any politically relevant timeline.
Formula: Time-Adjusted Alpha = Qualification Months × Severity
The CHIPS Act allocates $52B+ to semiconductor reshoring. But ASML to TSMC has a 48-month qualification cycle at severity 5, producing a time-adjusted alpha of 20.0. No amount of money fixes this within a single election cycle. The time trap makes the dependency structurally permanent.
6. Process Taxonomy
A mapping of 17 distinct manufacturing processes (sintering, CVD, fluorine chemistry, ultra-pure synthesis, precision optics, cryogenic systems) to the companies that use them, across all 9 themes.
Instead of mapping companies by what they sell, we map them by how they make things. This reveals connections industry classification misses entirely. Toto (classified as "building materials") and Shin-Etsu (classified as "chemicals") both use precision ceramic sintering. The process connection reveals that a toilet company and a wafer maker share a manufacturing capability that makes both critical to semiconductor production.
Discovery example: The finding that Toto — the Japanese bidet company — makes electrostatic wafer chucks for AI memory chips came directly from process-level mapping. Palliser Capital called it "the most undervalued and overlooked AI memory beneficiary." The process taxonomy is our discovery engine for finding the next hidden chokepoint.
7. Convergence Integration
All 34 scanner sources are overlaid onto the supply chain graph via a catalyst integration layer. For each of the 985 companies in the graph, we compute a composite "catalyst heat" score (0–10) based on convergence data, options flow, insider filings, activist stakes, short interest, and 8-K events.
This is where the convergence engine and the supply chain graph merge. A convergence hitting a severity-5 chokepoint node produces a fundamentally different indicator than one hitting a commodity company — because only ForcedAlpha has both the convergence engine and the severity scores to make that distinction.
Currently 101 of 985 graph companies match to at least one scanner source, with 233 total catalyst data points integrated.
8. Demand & Application Modeling
The physical supply chain maps what feeds into production. The demand layer maps who consumes the output — and how consumption patterns create upstream pressure. Data center operators (WULF, CORZ, HUT, NBIS, CRWV) don't just buy GPUs; they consume power, cooling, fiber, and rack infrastructure simultaneously. Drone platforms (AVAV, RCAT, UMAC) consume sensors, GaN chips, and carbon fiber in patterns that mirror but don't equal defense contractor demand.
The demand layer adds 19 application-level nodes across 6 subtypes: datacenter operators, drone platforms, satellite operators, aerospace OEMs, EV manufacturers, and edge computing companies. Each is connected to its upstream supply chain with criticality-weighted edges. This lets the engine compute demand-pull cascades: when a datacenter buildout accelerates, which upstream materials hit capacity constraints first? The answer isn't obvious without the graph — it's often a specialty chemical or a precision optics component three hops upstream.
9. Capital Flow Intelligence
Six government financing programs are modeled as nodes in the graph: DOE Loan Programs Office ($400B authority) , CHIPS and Science Act ($52.7B) , Export-Import Bank ($135B) , DFC ($60B) , METI (Japan Ministry of Economy), and DARPA. Each has directed edges to every company it funds, with the specific program (grant, loan guarantee, contract) annotated on the edge.
When a scanner source detects activity matching a financing program — a DOE loan approval, a CHIPS Act disbursement, a DARPA contract award — the catalyst integration layer propagates that event through the financing edges to all funded companies. This creates 6-18 month lead time catalysts: the capital commitment precedes revenue impact by quarters, but the graph sees the connection immediately. Currently tracking 32 financing relationships across 29 funded companies.
Why Layering Matters
Anyone can read an SEC filing. The edge isn't in the data — it's in what happens when you layer structurally distinct lenses on the same ticker simultaneously.
The proven foundation: A senator buys a defense stock while the chart breaks out on volume. That two-domain convergence — political insider + market confirmation — produced a 7/7 hit rate in our backtest.
The thesis we're testing: Adding more structurally distinct layers — lobbying spend, institutional accumulation, federal contracts — should improve outcomes further. Each additional domain that fires from a different institutional process reduces the probability of coincidence. We're tracking these multi-domain convergences through resolution now.
Our system identifies causal chains across data layers. We've mapped the historical lead times between lobbying activity and contract awards, between congressional committee trades and sector legislation, and between federal job postings and budget announcements. These timing relationships are built into how we weight each data point.
Model Training & Feedback Loop
We train our analysis models on every historical convergence — and every new one detected in real-time. Each outcome gets fed back into the weighting system. Early versions treated all data points equally. After training on outcome data, the system learned which attributes actually matter.
The Key Finding: Committee Relevance
This is the single most important thing our system has learned so far:
Committee-relevant trades make up only 12% of all congressional trades in our dataset. But they are disproportionately represented in our highest-scoring convergences. When a senator on the Armed Services Committee buys a defense contractor, that is a fundamentally different data point than a random representative buying the same stock — the committee member has direct jurisdiction, non-public briefing access, and advance knowledge of upcoming legislation.
The precise performance differential (win rate and excess return vs. non-committee trades) isn't publishable yet because the resolved convergence sample is too small (N=7) to split further. As the sample grows, we'll publish the full breakdown. For now, committee relevance is weighted more heavily in scoring based on the directional pattern, not a statistically rigorous comparison — but the pattern is strong enough that it changed how the entire system works.
The full committee performance breakdown is available to Pro members. Browse live committee-tagged trades →
Backtest Results
The systematic backtest covers Congressional + Technical convergences — the two source types with sufficient historical data for quantitative analysis.
We have 5 years of congressional trade disclosures and 5 years of technical pattern data. That's enough to build a proper control group and measure outcomes. Lobbying, 13F, federal contracts, and policy data are tracked live but don't yet have enough resolved convergence events to backtest rigorously. Those source types appear in the active case studies below — we're tracking them through resolution to build that dataset.
526 total technical events analyzed between 2021–2025. Of those, 7 qualified as cross-category convergences — a committee-relevant congressional trade disclosure coinciding with a technical breakout on the same ticker within 30 days.
The 7 Resolved Convergences (Congressional + Technical)
| Ticker | Source Categories | Detection Date | 3M Return |
|---|---|---|---|
| AVGO | Congressional + Technical | May 8, 2025 | +47.1% |
| AMD | Congressional + Technical | Jul 16, 2025 | +36.2% |
| AVGO | Congressional + Technical | Jun 3, 2025 | +18.0% |
| LHX | Congressional + Technical | Jun 11, 2025 | +14.3% |
| NVDA | Congressional + Technical | Jun 27, 2025 | +13.0% |
| BAC | Congressional + Technical | Jun 27, 2025 | +11.4% |
| GE | Congressional + Technical | Jul 14, 2025 | +11.3% |
AVGO appears twice because it was detected in two separate 30-day windows. That's not double-counting — it's the system flagging the same name separately at different points as new data arrived.
The Control Group
526 isolated technical events — single-source chart patterns with no cross-category confirmation — produced a 48.7 win rate with a mean return of +3.2 and a median of -0.2 at 3 months. Essentially a coin flip.
Structural distinction, not pattern count, drives the edge. Adding one structurally distinct non-technical source — a congressional trade disclosure — changed the outcome from coin-flip to directionally strong. N=7 is not statistically conclusive, but the mechanism is clear: when people with policy access are positioning in the same direction as the chart, something has shifted.
Out-of-Sample Validation
This is the strongest methodological claim we can make: the system was not tuned on these results. Scoring parameters — time window thresholds, source weights, committee relevance multipliers — were all defined using 2021–2023 data. Every one of the 7 resolved convergences in the table above occurred in 2024–2025, after the parameters were locked. The system produced these results on data it was never trained on.
This matters because the most common failure mode in quantitative backtesting is overfitting — tuning parameters until they explain historical data perfectly, then watching them fail on new data. Our separation of training period (2021–2023) from validation period (2024–2025) is designed to guard against exactly that failure.
Methodology notes:
Returns measured from detection date to 90 calendar days, using closing prices. No lookahead bias. All 7 cross-category convergences are congressional + technical (2 source types). As we accumulate more data from additional source categories (lobbying, 13F, contracts), we expect the convergence sample to grow.
Survivorship bias applies (delisted tickers excluded). No transaction costs modeled. Returns are absolute, not risk-adjusted — we do not yet benchmark against sector or market indices.
This is historical performance. It does not predict future results.
Full backtest data, including technical-only losses →
Multi-Domain Case Studies (Active)
Beyond the systematic backtest, we track richer multi-domain convergences that include lobbying, 13F, policy, and contract data. These are newer source combinations with smaller sample sizes — not yet systematically tested, but tracked through resolution to build the dataset that will eventually allow a proper backtest of the full multi-source thesis.
The Congressional + Technical backtest above proves the foundational mechanism: structural distinction between sources improves outcomes. The case studies below test whether more structurally distinct domains improve outcomes further.
Six structurally distinct data layers pointing at the same name simultaneously. Three of the world's largest hedge funds opened or added positions while the company ramped lobbying 74% QoQ and Congress traded both sides of the aisle. Institutional, congressional, lobbying, lobbying lead, policy, and options all firing from different institutional processes.
A completely different convergence pattern — not tech-driven, but policy-forced. The government invoked the DPA, invested directly, secured financing, mandated domestic sourcing — and the chart confirmed positioning ahead of the announcement cascade. Five structurally distinct domains firing: trade policy, government stake, White House EO, technical confirmation, and directional options flow.
Specific tickers, convergence scores, dollar amounts, and detection dates are available to Pro members.
The methodology is free. The actionable output is Pro.
Unlock Active Convergences →Every convergence alert is tracked from detection through 90-day resolution — wins and losses both. See full results →
What We Get Wrong (And Why That Matters)
- Filing delays are real. Congressional trades can be disclosed up to 45 days late. 13Fs are quarterly with a 45-day lag. Returns are measured from disclosure date, not trade date.
- Convergence isn't causation. A high score means multiple structurally distinct sources align. It doesn't mean the trade works. Position sizing and risk management still matter more than data quality.
- Small sample at the top. 7 resolved cross-category convergences is directionally strong but not statistically conclusive. A 7/7 hit rate is more likely small sample luck than system perfection. We publish every convergence at detection — not after resolution — specifically so this record can't be curated after the fact. As the sample grows, we expect losses.
- Returns are not risk-adjusted. The backtest table shows absolute 3-month returns. We do not benchmark against sector indices, market returns, or risk-free rates. AVGO +47% during a strong semiconductor run is a different result than +47% when the sector was flat. Sector-relative benchmarking is a planned addition.
- Source distinction is imperfect. We categorize sources by domain to enforce structural distinction, but some sources share common upstream drivers. A congressional trade and a lobbying spike may both reflect the same policy momentum rather than two truly distinct observations. This is exactly why we require cross-category convergence rather than within-category stacking, but it's an inherent limitation.
- Graph edges are manually researched. Each edge in the supply chain graph requires reading technical literature to identify material dependencies. We may miss dependencies, especially in rapidly evolving supply chains. Severity scores involve judgment — we publish the metrics and examples but not the weighting formula.
- Black swans exist. No model accounts for exogenous shocks. This is why we never suggest "all-in" on any alert.
- Some of our calls will be wrong. Every alert is timestamped. We're building a public scorecard — wins and losses both. If the system stops working, the data will show it before the marketing does.
From Convergence to Conviction: Quantitative Models
Convergence detection tells you what to watch. The next question is harder: how much edge does a convergence actually create, and how do you express it?
We built three quantitative layers on top of the convergence system. Each one takes raw convergence data and transforms it into something more precise.
Bayesian Scenario Engine
Traditional analysts assign scenario probabilities by gut feel — "40% bull, 40% base, 20% bear." We replace that with a self-calibrating Bayesian model that updates probabilities as new evidence arrives.
Each playbook ticker gets a growth profile (geometric compounder, inflection play, structural catalyst, or cyclical). The profile determines the shape of the probability distribution. Then, as convergence data, earnings results, and institutional positioning change, the model shifts probability mass between scenarios using learned evidence weights.
Worked example — Bloom Energy (inflection profile):
Prior: 30% bull / 40% base / 30% bear (wider spread because inflection plays are binary). New evidence arrives: multiple institutional funds hold positions, a domain-expert fund triples its stake to a highly concentrated position, and the convergence score rises from 60 to 68. The model ingests each evidence type with a learned weight and shifts probability mass toward bull: updated posterior becomes 42% bull / 38% base / 20% bear.
The shift isn't arbitrary. Evidence weights are derived from historical convergence outcomes — the model has learned that a 13F concentration increase above 10% of AUM shifts probability significantly more than a marginal options flow event, and that a convergence score crossing 65 (the historical threshold where outcomes improve) carries more weight than a linear score increase. These weights self-calibrate as more outcomes resolve.
The engine runs daily. Every prediction is logged with a timestamp, so we can measure calibration over time: did 60% predictions actually happen 60% of the time? Early results are promising but the sample is too small to claim calibration. Scenario tables on each playbook reflect these Bayesian-derived probabilities, not editorial estimates.
LEAPS Mispricing Detector
Options markets price the probability of a stock reaching any given strike price at expiration. This is the "market's view" — derived from implied volatility and the Black-Scholes framework. It's mathematically clean and well-understood.
Our system computes an alternative view: what is the probability of reaching that strike, given convergence data the market may not be pricing? The difference between these two probabilities — the "edge" — identifies options contracts where the market may be underpricing structural catalysts.
We classify each company's growth profile, compute a structural uplift based on convergence score and profile type, and then scan LEAPS contracts (12-24 month expiration) for the widest divergences. The result is a mispricing score (0-10) for every contract, adjusted for liquidity and open interest.
Worked example — how mispricing is detected:
A stock trades at $50. The options market implies a 15% probability of reaching $80 by January 2028 (derived from implied volatility via Black-Scholes). Our Bayesian engine, informed by convergence data the options market doesn't price, estimates 19.5% probability for the same outcome. That 4.5pp gap — the structural uplift — is the mispricing. Divided by the market's probability, it yields a mispricing ratio of 1.30x, which maps to a score of ~7/10. The higher the ratio and the more liquid the contract, the higher the score.
Limitation: Our structural probability adjustment adds at most 4.5 percentage points to the market's implied probability. This is deliberately conservative — structural catalysts can take longer to materialize than the option's lifetime, and the market is not always wrong. The edge we identify is small, persistent, and horizon-dependent. Live LEAPS scanner →
Macro Regime Overlay
Not all market environments are equal. A convergence detected during a credit stress event carries different risk than the same convergence during calm markets. Our regime detector scores four macro dimensions daily:
Credit conditions (investment-grade and high-yield spreads), rate expectations (Fed funds futures), institutional positioning (CFTC Commitments of Traders), and treasury demand (auction bid-to-cover ratios). These combine into a regime classification: Risk-On, Neutral, Cautious, or Risk-Off.
The regime modulates how aggressively we interpret convergence data. In Risk-Off environments, cyclical uplift is zeroed out entirely, and confidence adjustments compress. In Risk-On environments, the full structural uplift applies. This prevents the system from being blindly bullish during macro deterioration.
Worked example — regime modulation in action:
A ticker has a strong convergence (score 75, 3 sources). In a Risk-On regime, the LEAPS detector applies the full structural uplift — say +3.2pp above market-implied probability. Same ticker, same convergence, but credit spreads blow out 40bps and treasury auctions fail: regime flips to Risk-Off. Now the cyclical component of the uplift is zeroed, and the structural component compresses by 40%. The effective uplift drops to +1.9pp. Same data, different context, different sizing. The system doesn't ignore the convergence — it adjusts how aggressively it interprets it.
Current regime: displayed live on the LEAPS scanner and leaderboard, updated daily.
On model confidence: These quantitative layers are new — the Bayesian engine has been running since February 2026 and the LEAPS detector since the same month. We have weeks of data, not years. The models are designed to be conservative and self-correcting, but they have not been tested through a full market cycle. Treat their outputs as one input among many, not as trading recommendations.
Institutional Convergence: Real Examples
Our 13F scanner tracks 24 elite fund managers and 8628 total holdings. Below are two real examples from Q4 2025 that illustrate how institutional convergence surfaces in our system.
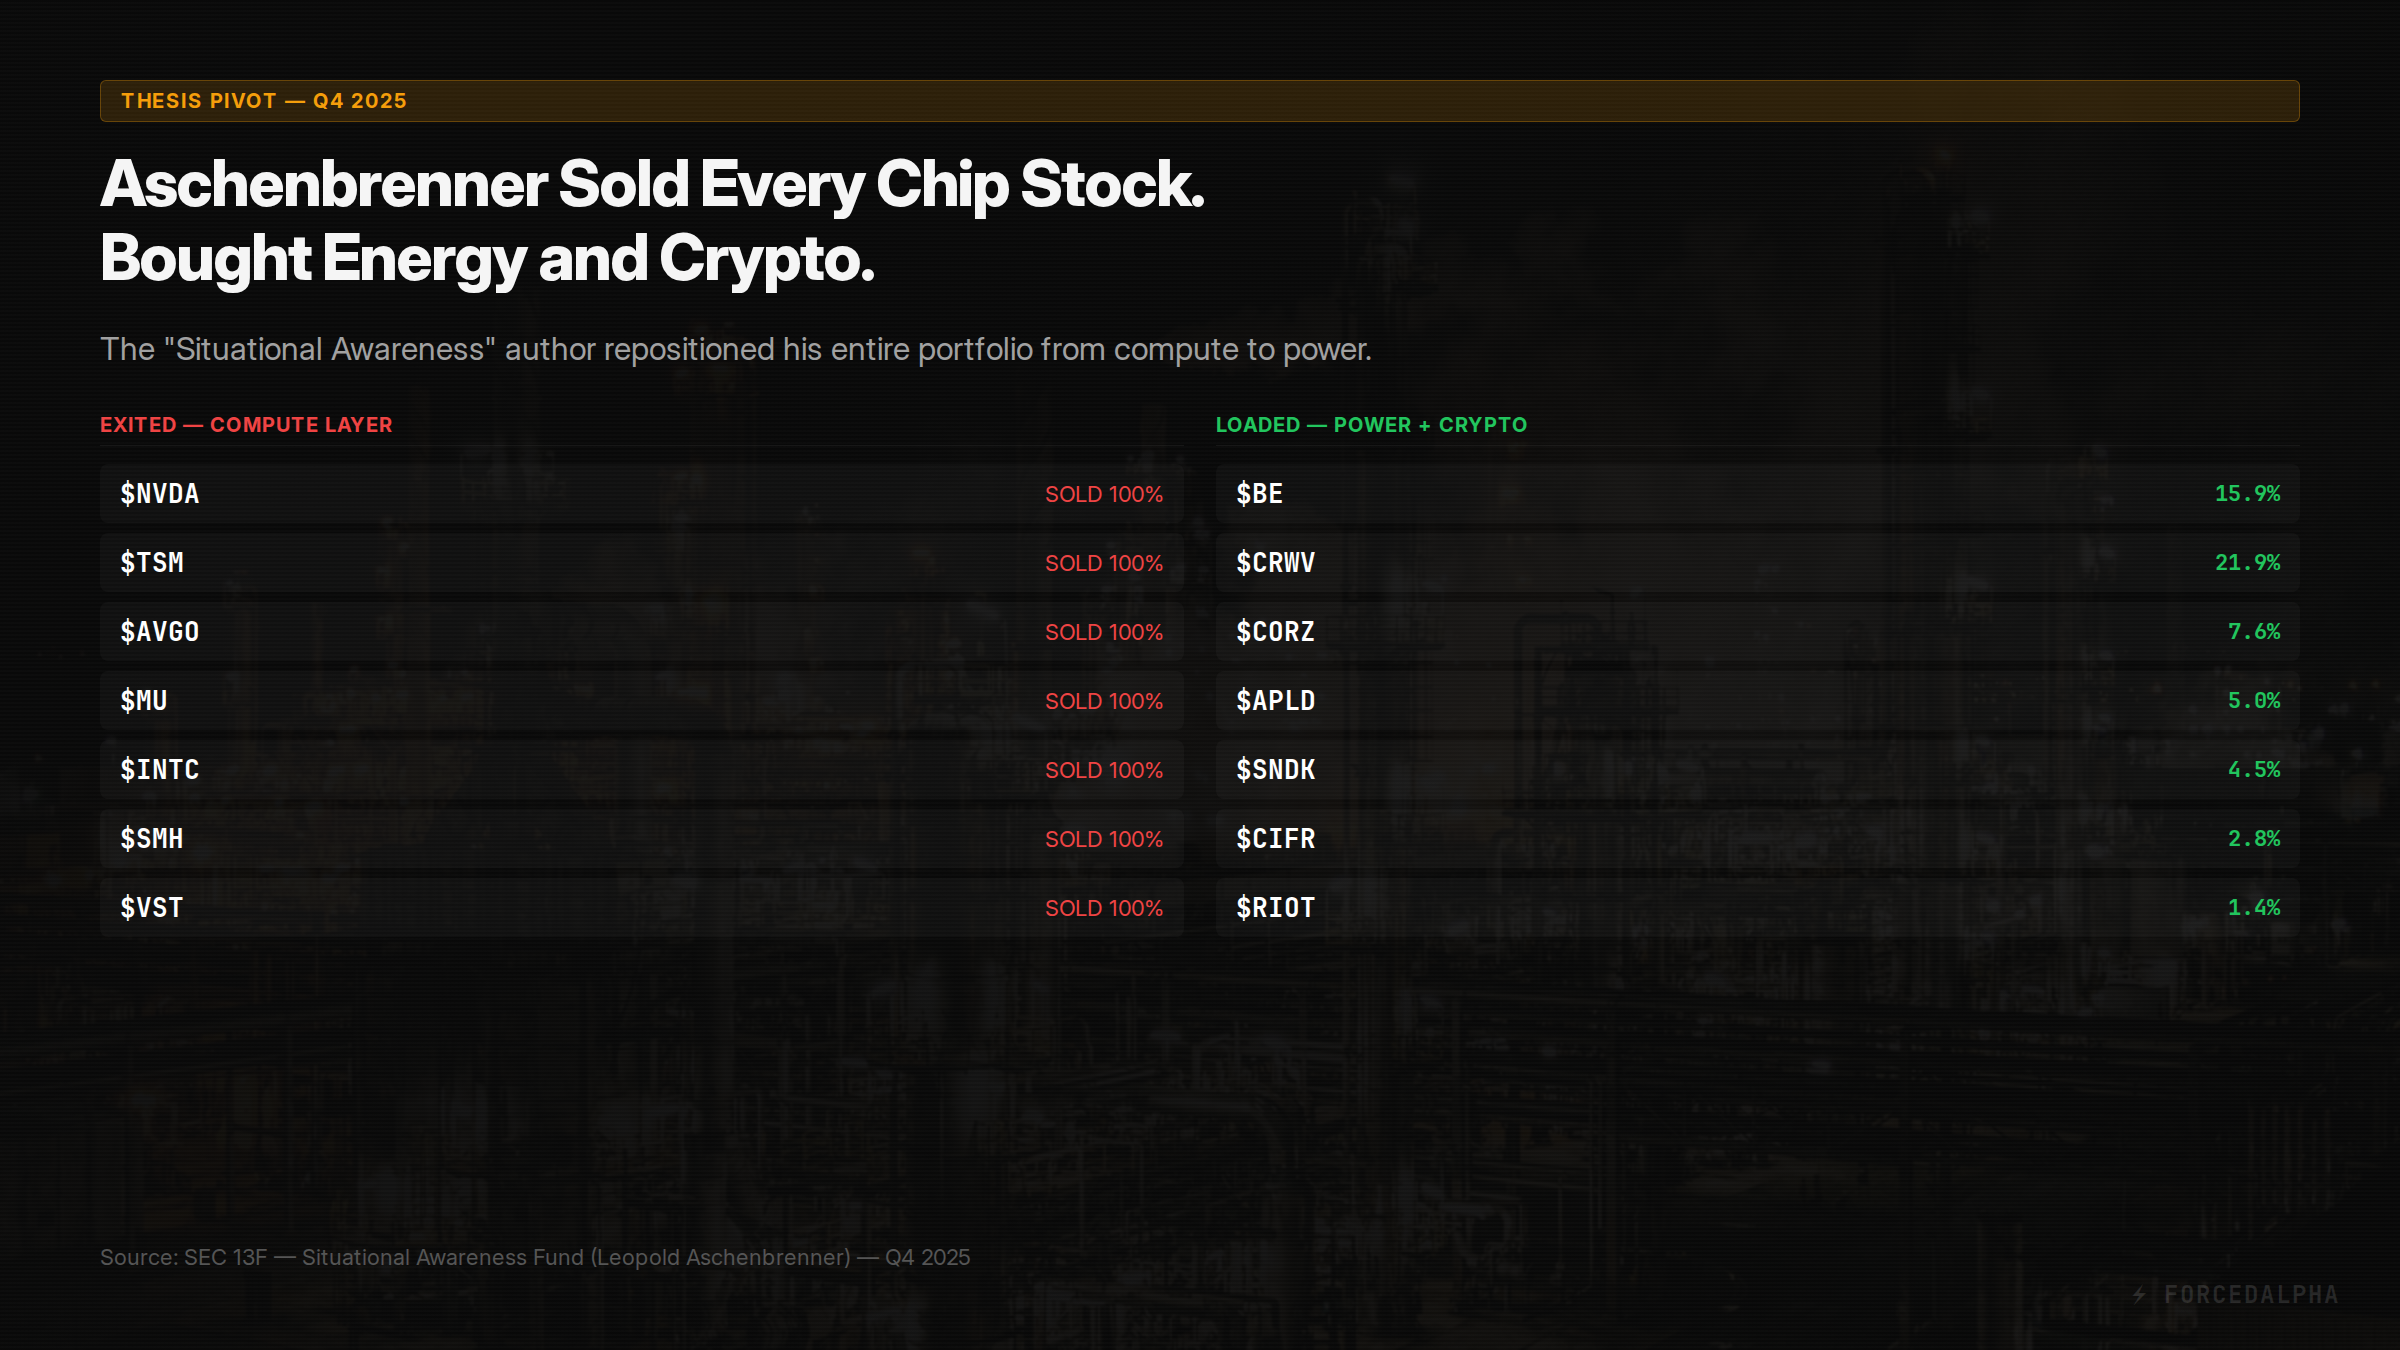
Compute → Power rotation. Leopold Aschenbrenner — the ex-OpenAI researcher behind "Situational Awareness" — exited every chip stock (NVDA, TSM, AVGO, MU, INTC, SMH, VST) and loaded energy + crypto infrastructure. His #1 position: Bloom Energy at 15.9% of portfolio . In our taxonomy, this is a Layer 7 (Compute) to Layer 4 (Power) rotation. The thesis: AI's bottleneck shifted from chips to electricity. When the person who wrote the most cited AI scaling paper bets his fund on it, that is a high-conviction data point.
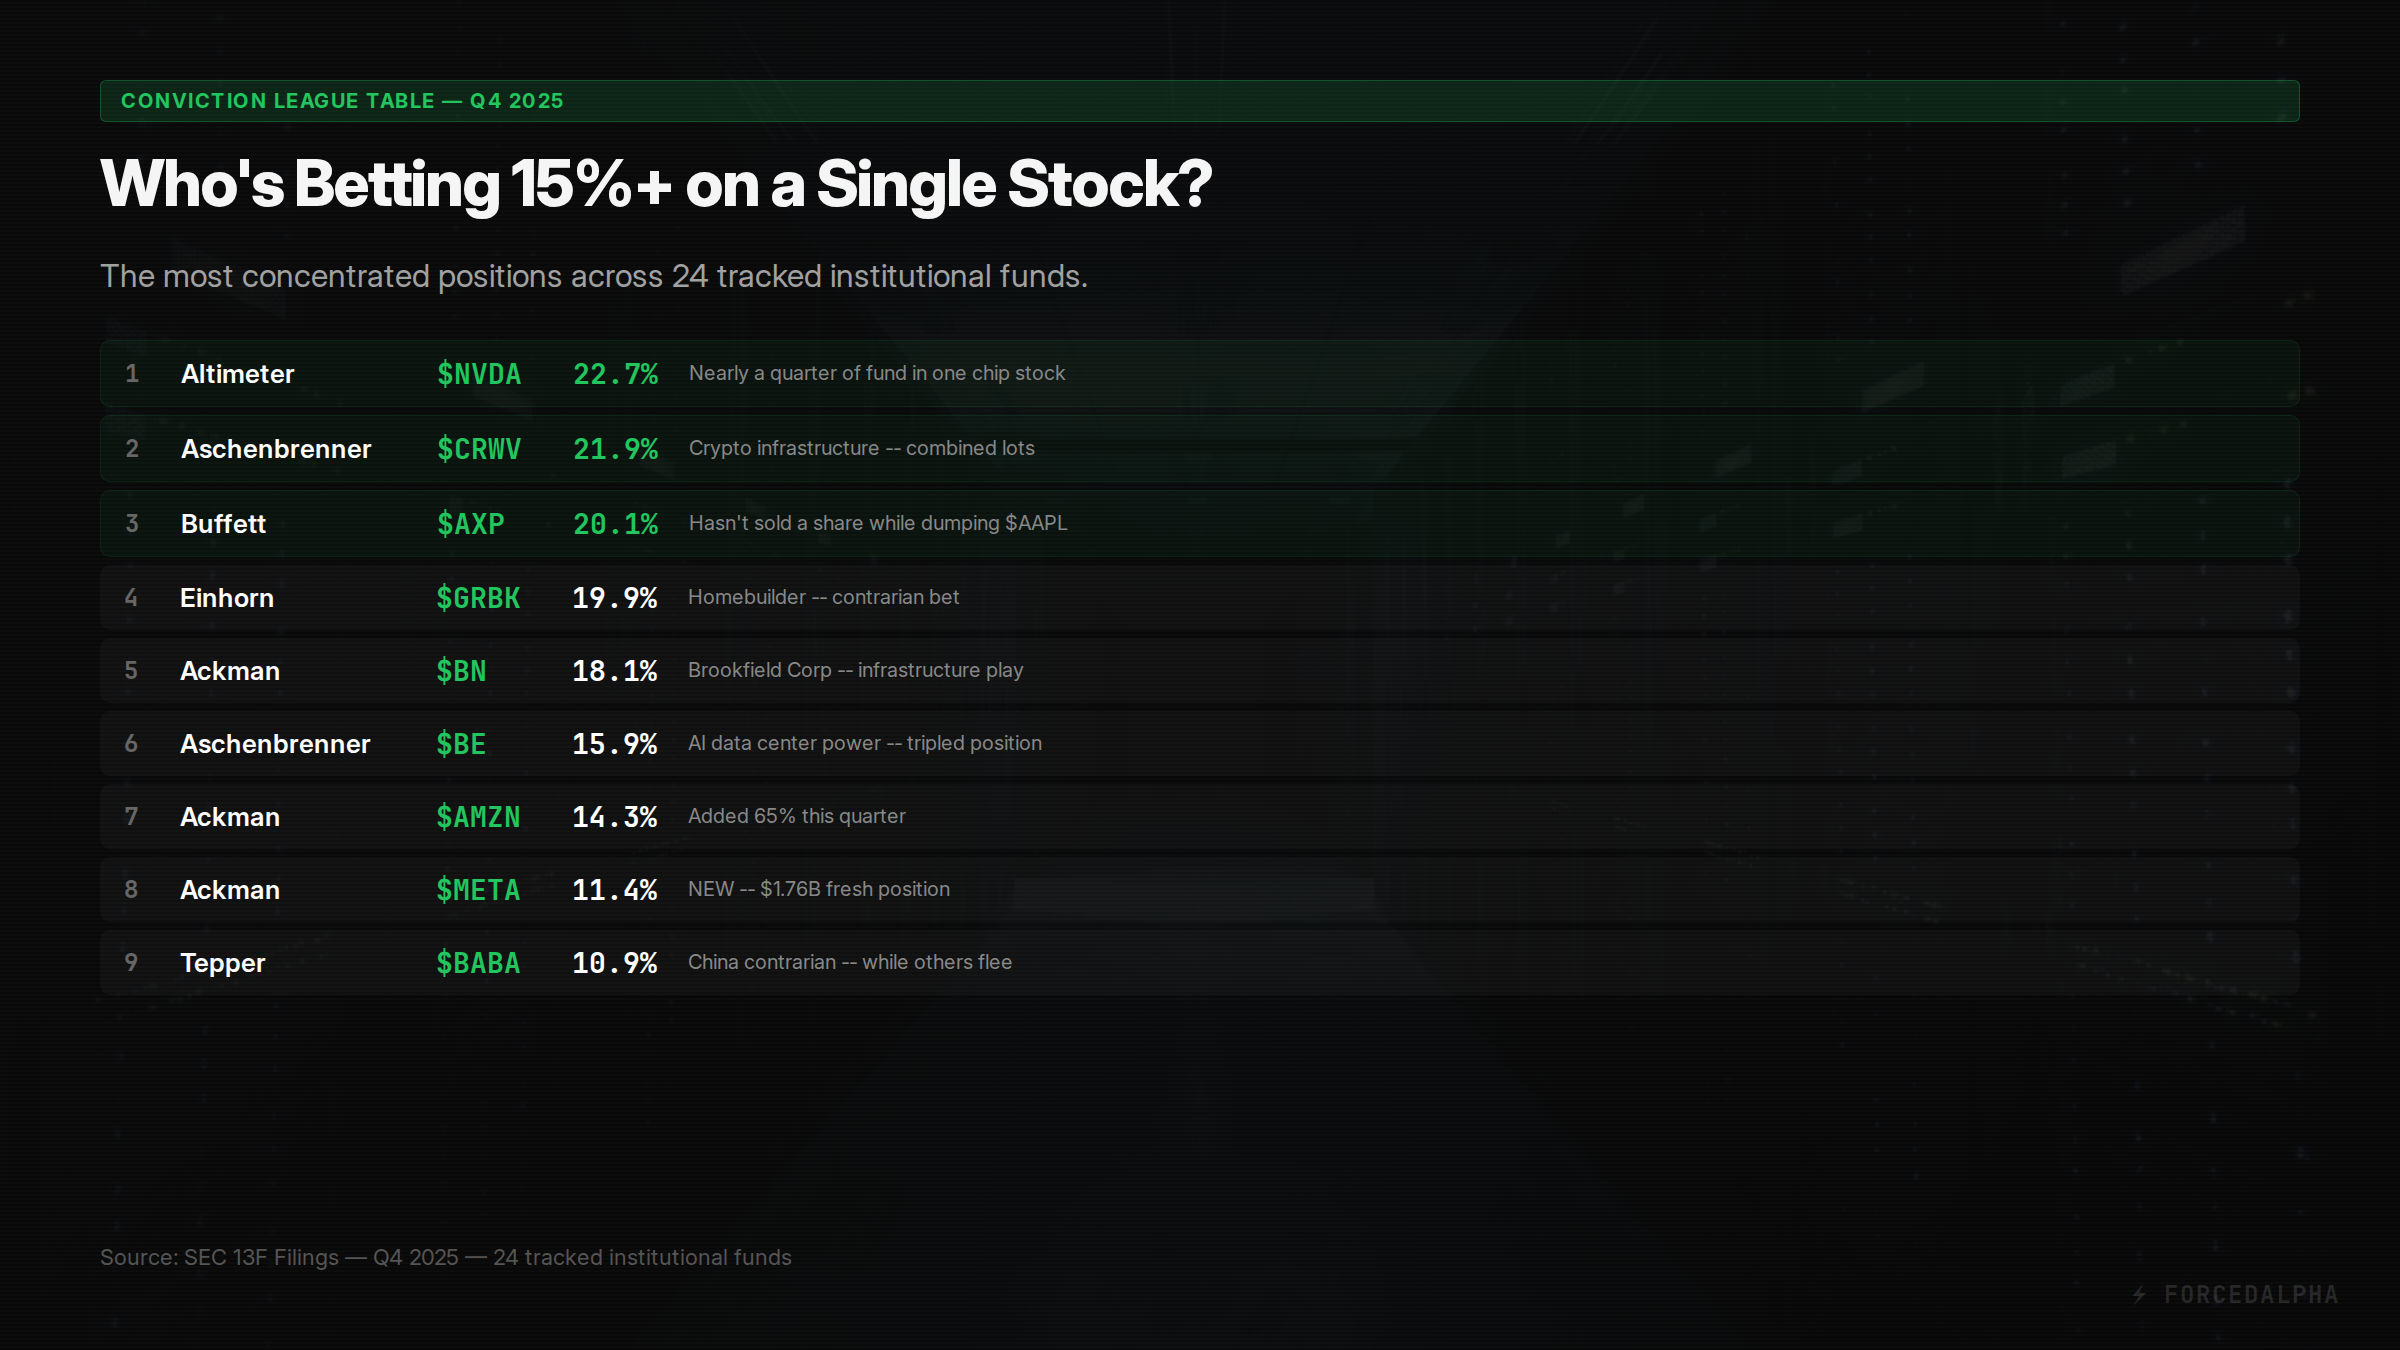
Concentration = conviction. Diversification is protection against ignorance. When Altimeter puts 22.7% in NVDA , Aschenbrenner puts 21.9% in CRWV , and Buffett holds 20.1% in AXP while selling everything else — these managers are not diversifying. They're making a statement. Our system ranks all 24 tracked managers by single-name concentration to surface these high-conviction bets that passive allocation models miss entirely.
Deep Dive Playbooks
For the highest-scoring convergences, we build full thesis documents covering sector context, financials, catalyst timelines, bear case, and trade structure with falsification triggers.
Each playbook includes convergence scoring, Bayesian scenario probabilities, catalyst timeline, bear case with falsification triggers, and LEAPS positioning. All 7 playbooks →
← Back to methodology overview
See It In Action
Browse live convergence alerts, congressional trades, institutional holdings, and deep-dive playbooks.
Browse Tools →